Many readers will have already seen one of the numerous reports about a recent study by two climate scientists and a statistician, which demonstrates that the three sets of “adjusted” temperature data used by climate alarmists are “totally inconsistent with published and credible U.S. and other temperature data.”
James Delingpole’s is one of these reports. In it, he highlights the major finding of the study that the adjustments done to the NASA, NOAA, and UK’s University of East Anglia Hadley Climate Research Unit (Hadley CRU) data sets are obviously tendentious.
The adjustments have been done to make earlier temperature periods look cooler than they actually were, and to make recent warmer periods look warmer than they actually were. The result produces an exaggerated appearance of seminal “warming” in recent decades.
Once more, to be clear: the study’s researchers had access to the raw data, and compared it with the adjusted data in the NASA, NOAA, and Hadley CRU data sets. What they found was that the adjustments accounted for virtually all of the “warming.”
Delingpole quotes meteorologist Joe D’Aleo, one of the researchers:
Nearly all of the warming they are now showing are [sic] in the adjustments.
Each dataset pushed down the 1940s warming and pushed up the current warming.
You would think that when you make adjustments you’d sometimes get warming and sometimes get cooling. That’s almost never happened.
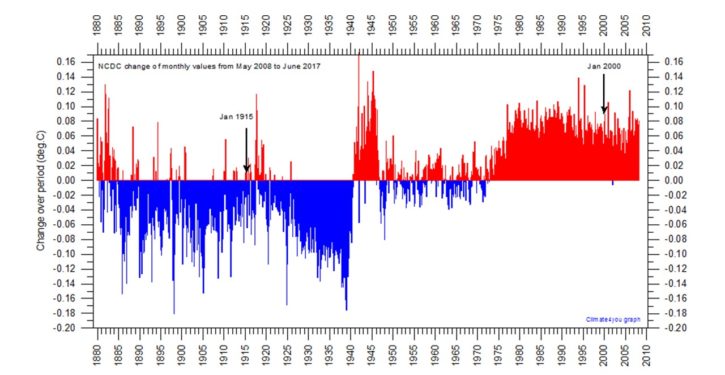
The now-viral chart below, from the study, is a startlingly informative presentation. The blue indicators show artificial adjustment downward – exaggerated and overwhelmingly dominant before the year 1940. The red indicators show artificial adjustment upward – exaggerated and overwhelmingly dominant after 1940.

I notice that most blog posts are leaving the matter there, with the high-impact visual of the graphic.
But the study itself highlights something equally important. The EPA’s 2009 “endangerment finding” on greenhouse gases (GHG) was based on these artificially adjusted data sets, which are “totally inconsistent with published and credible U.S. and other temperature data.”
The 2009 endangerment finding is the basis for most of the major EPA regulations imposed by the Obama administration from 2011 to 2016, including unrealistic emission regulations for coal power plants, and the Clean Power Plan. It’s also the basis for the Obama administration’s drastically tightened CAFE rules for motor vehicle emissions, which are expected to add thousands to the prices of car and trucks.
The study is pointed on this matter:
The relevance of this research is that the validity of all three of the so-called Lines of Evidence in EPA’s GHG/CO2 Endangerment Finding require GAST data to be a valid representation of reality. …
The conclusive findings of this research are that the three GAST data sets are not a valid representation of reality. In fact, the magnitude of their historical data adjustments, that removed their cyclical temperature patterns, are totally inconsistent with published and credible U.S. and other temperature data. Thus, it is impossible to conclude from the three published GAST data sets that recent years have been the warmest ever – despite current claims of record setting warming.
Finally, since GAST data set validity is a necessary condition for EPA’s GHG/CO2 Endangerment Finding, it too is invalidated by these research findings.
The impact of climate researchers adjusting their data with prejudice isn’t just theoretical. It’s already here, in every coal plant closed down because EPA rules made it impossible to run any longer, every coal-related job lost, and the billions in economic activity we have not had because of increased utility costs, and other regulatory costs imposed by the EPA, since the endangerment finding.
A few significant points. One, as NewsBusters points out, this recent study is only the latest of many that have conclusively shown manipulation of the temperature data. We have known about this for years, at different levels of detail and granularity.
Two, the new study is peer-reviewed – a quality noticeably lacking in the EPA’s technical support documentation for the 2009 endangerment finding. The EPA’s own OIG called out the agency for having its “peer reviews” done by – not making this up here – the “very scientists who helped write and develop it.”
The EPA also failed to consider dissenting research in its findings process. On both counts, the EPA OIG indicated that the agency violated the law governing its procedures.
This shoddy, dishonest work was not just protected by the Obama administration; it was promoted and leveraged to implement a regulatory agenda that not only suppressed economic activity, but “justified” throwing more billions of borrowed public money at “green energy” projects (some of the biggest failures with crony ties to Obama).
Unquestionably, Obamacare has had one of the most important suppressing effects on the U.S. economy in recent years. But EPA regulations have been imposing a more entrenched, less visible cost for much longer, and were significantly intensified under the Obama administration. If the actions of the Obama EPA are not reversed, the drag on the American economy is scheduled to increase with each coming year. Not even improved policies in other areas — taxes, other regulatory regimes — can overcome that negative influence.
The springboard for EPA’s regulatory intensification under Obama was the endangerment finding of 2009. And that finding was based on data sets so manipulated that they’ve been found to be “totally inconsistent with published and credible U.S. and other temperature data.”